

A display does more than show an image: standard display systems convert digital signals into visible pixels and refresh the full pixel array 60 to 120 times per second. That process shapes how smoothly motion appears and how clearly details register on screen. Understanding the underlying display choices makes it easier to compare systems for their intended work.
Resolution and screen size are only part of the picture. Color, contrast, aspect ratio, viewing conditions, and gradual brightness loss also affect what you see and how useful a display remains over time.
This reference explains how displays form and refresh images, what luminance, color gamut, and contrast tell you, and how aspect ratios affect image dimensions. It also covers backlight degradation and service life, helping you interpret specifications and assess which characteristics matter for your application.
Key Takeaways
- Understand how pixel refresh affects motion clarity, and how ergonomic guidance such as ISO 9241, according to the International Organization for Standardization, relates to human-system interaction.
- Use luminance, color gamut, and contrast together to judge how clearly a display can present images in its viewing environment.
- Match aspect ratio and resolution to the content and workspace to reduce unnecessary cropping or scaling.
- Track brightness changes and plan for long-term display compatibility to make more informed service-life decisions.
Image formation and refresh rates
Image formation is the process of turning a digital signal into visible screen content. A pixel is the smallest addressable picture element, and a display arranges pixels in rows and columns. For example, Full HD, also called 1080p, uses 1920 × 1080 pixels. That format describes the image’s pixel dimensions, while the display’s electronics determine how those pixels receive image data.
A refresh rate is the number of times a display updates its full pixel array each second. Standard display systems typically scan the array 60 to 120 times per second. Each update replaces or adjusts the displayed pixel values, producing the changing frames that viewers perceive as motion. A higher refresh rate can make movement appear smoother, but it doesn’t by itself define image detail or color accuracy.
A frame is one complete image in a moving sequence. Gaming and extended reality displays use refresh rates above 120 Hz to reduce motion blur and latency. The practical comparison is the content being shown: rapidly moving graphics place more emphasis on frequent updates than a static image. Refresh rate is therefore a useful specification, but it describes timing rather than the screen’s resolution.
Interlacing is a method that draws alternating sets of image lines, while non-interlaced scanning draws the full image sequentially. Non-interlaced monitors with automatic degaussers were described as offering faster refresh rates and less flicker. A degausser is a mechanical feature associated with older display technology. IBM’s Color Graphics Adapter, introduced in 1981, marked an early color graphics format for IBM PCs.
Ergonomic standards address how people interact with display systems, not just how images update. ISO 9241 is a standard on ergonomics of human-system interaction, according to the International Organization for Standardization. The Health and Safety Executive’s cited UK guidance on display screen equipment is HSE L26, 2nd edn. Together, these references help frame display use around both technical presentation and the human task.
Luminance, color gamut, and contrast
Display comparisons depend on more than pixel count: brightness, color reproduction, and contrast all shape the visual result. Evaluate standard display systems and diagnostic monitors in relation to the image task, ambient light, and level of detail required.
Resolution describes pixel dimensions, brightness describes emitted light, and color accuracy describes how closely displayed colors match their intended values. Compare each separately, then consider how they work together during image review.
Luminance and Brightness
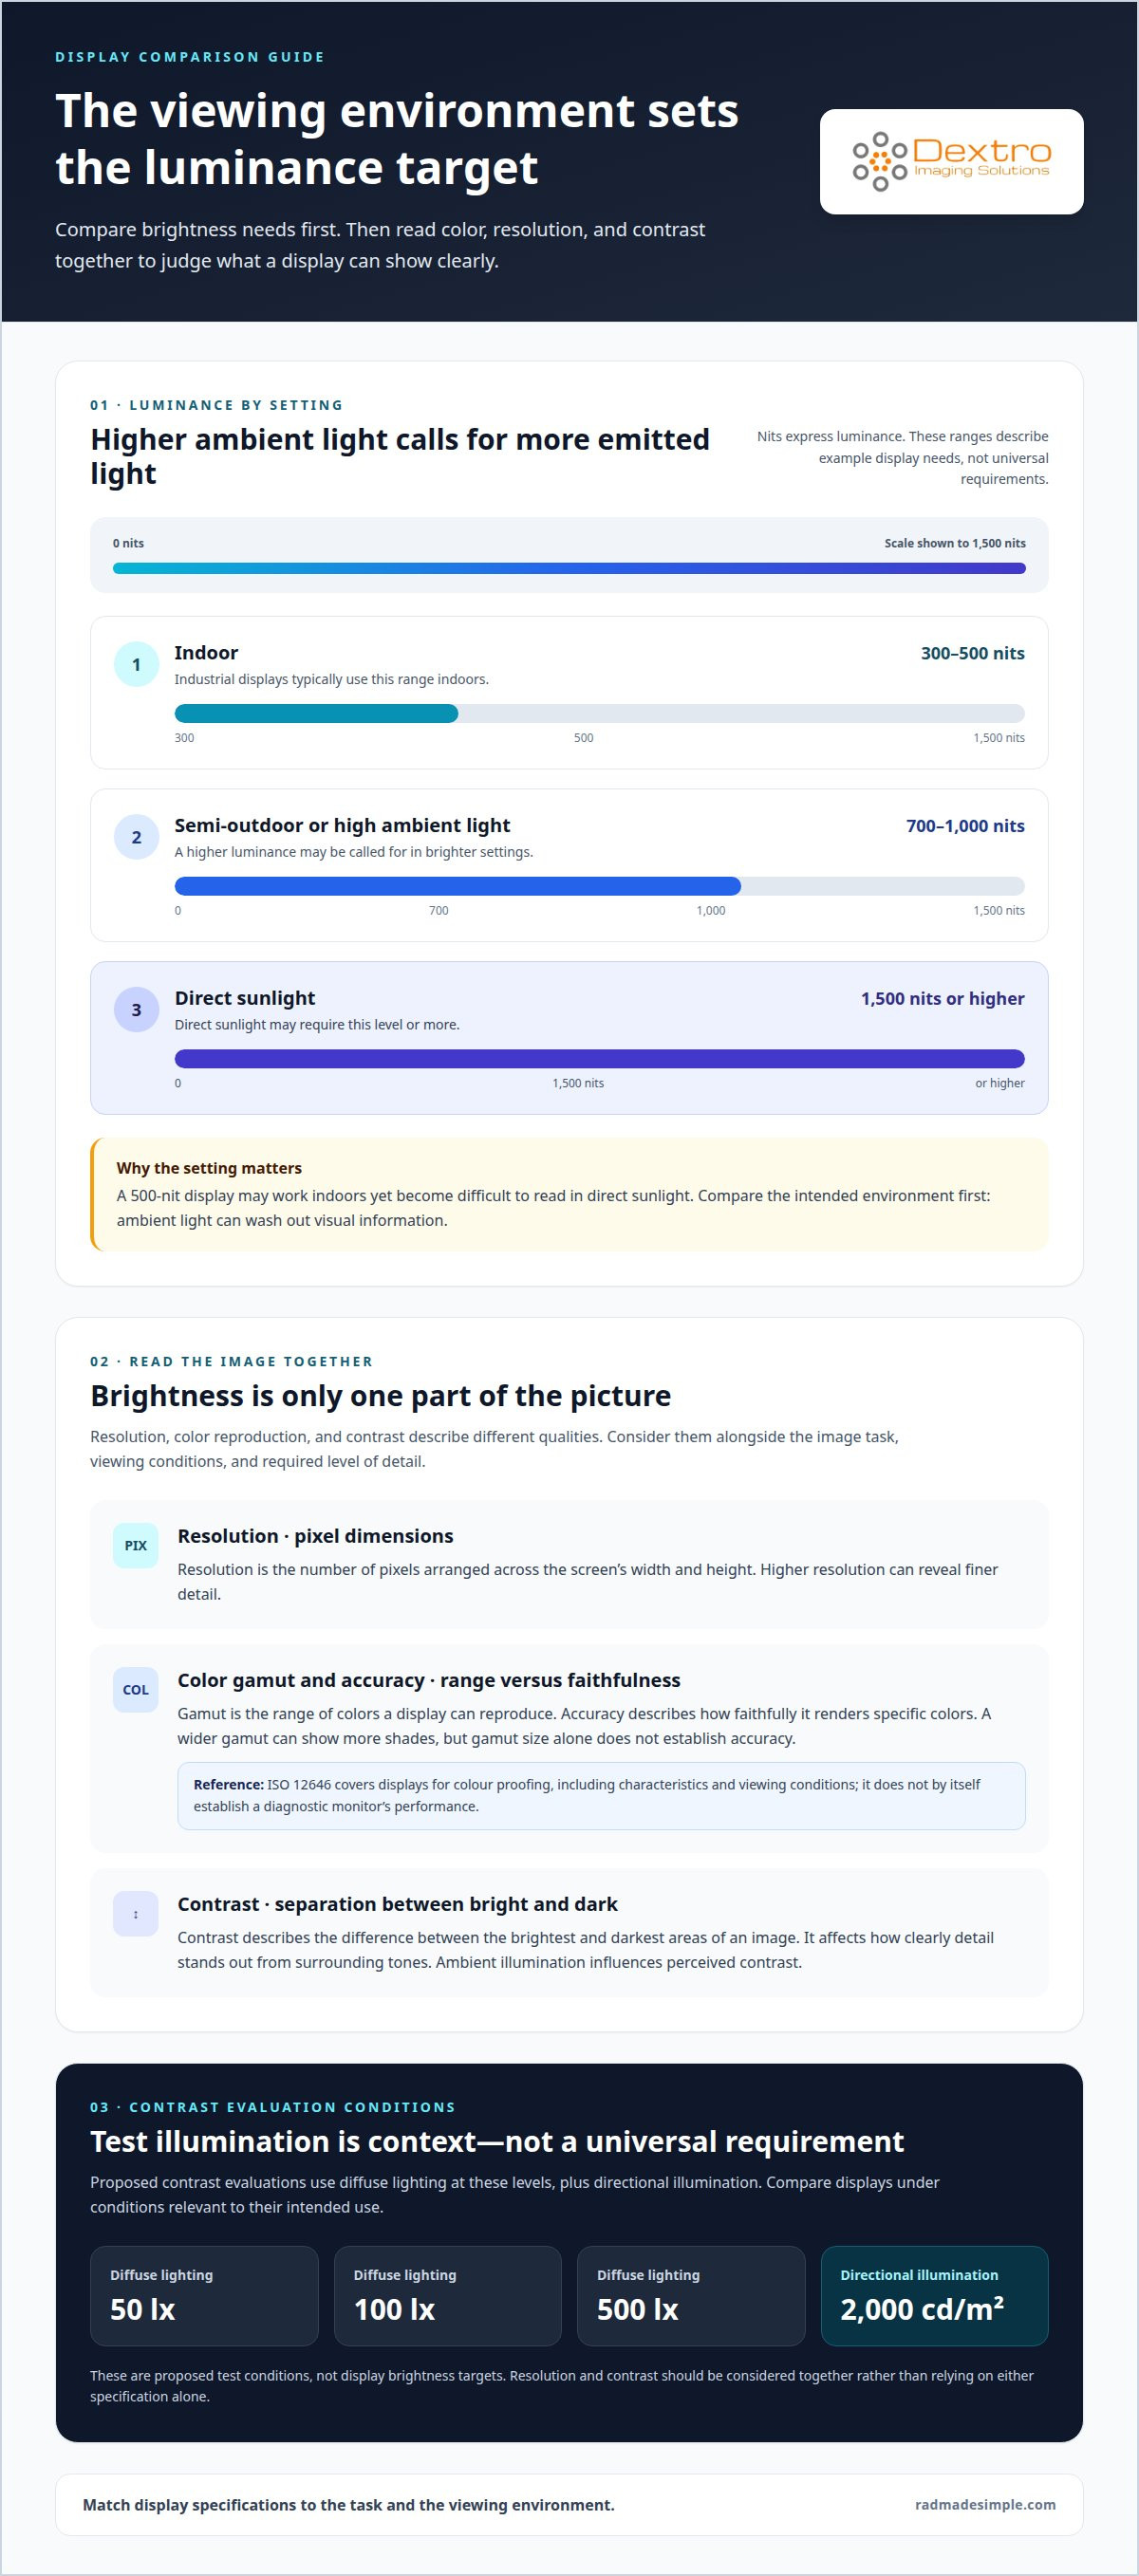
Luminance is the light emitted from a display surface, while brightness is its perceived visual intensity. Nits express luminance, and the useful level depends on the viewing environment. Industrial displays typically use 300-500 nits indoors; semi-outdoor or high-ambient-light settings may call for 700-1000 nits. Direct-sunlight applications may require 1500 nits or higher.
These figures illustrate why a brighter screen isn’t automatically better for every task. A 500-nit display may work indoors yet become difficult to read in direct sunlight. Compare the intended environment first, then consider whether ambient light could wash out visual information.
Color Gamut and Accuracy
Color gamut is the range of colors a display can reproduce, while color accuracy describes how faithfully it renders specific colors. A wider gamut can show more shades, but accuracy depends on color reproduction and processing, not gamut size alone.
For a practical comparison, consider the intended image workflow and whether consistent color matters. ISO 12646 covers displays for colour proofing, including their characteristics and viewing conditions. That reference concerns proofing; it doesn’t by itself establish a diagnostic monitor’s performance.
Resolution and Contrast
Resolution is the number of pixels arranged across a screen’s horizontal and vertical dimensions. Contrast describes the difference between the brightest and darkest areas of an image. Higher resolution can reveal finer detail, while contrast affects how clearly that detail stands out from surrounding tones.
Ambient illumination influences perceived contrast. Proposed contrast evaluations use diffuse lighting at 50, 100, and 500 lx, plus directional illumination of 2 000 cd/m 2. Treat these as test conditions, not universal display requirements. Compare screens under conditions relevant to their use, and consider resolution alongside contrast rather than relying on either specification alone.
For radiology-focused equipment comparisons, explore how the Radcom Compact fits your workflow.
Aspect ratios
An aspect ratio is the proportional relationship between a display’s horizontal width and vertical height. Common monitor screen sizes include 15, 17, 19, and 21 inches, measured diagonally; specifications also describe resolution and aspect ratio. For standard display systems, these measurements clarify screen dimensions and image shape, while pixel dimensions determine available detail.
Resolution is the number of pixels arranged across a display’s width and height. VGA provides 640 × 480 pixels, SVGA provides 800 × 600, and XGA provides 1024 × 768. These formats share a 4:3 shape, so content designed for one may fit another proportionally, though its detail depends on the native pixel count.
Native resolution is the pixel grid a panel is designed to display directly. WUXGA uses 1920 × 1200 pixels and a 16:10 aspect ratio, while SXGA uses 1280 × 1024 pixels and a 5:4 ratio. UHD 4K uses 3840 × 2160 pixels in a 16:9 format. These examples show why comparing only diagonal size can miss important differences between standard display systems.
Scaling adjusts an image to fit a screen with different dimensions or proportions. If the incoming signal doesn’t match a monitor’s native format, the display may resize, letterbox, or crop the image, depending on its settings. Check the source format and panel resolution together, especially when viewing several windows or image panels side by side.
For a practical comparison, match the monitor’s resolution and aspect ratio to the content and viewing task. A 16:9 screen suits a 16:9 source such as UHD 4K, while a 16:10 WUXGA panel provides a different vertical workspace. Display engineering also considers how graphics hardware sends the signal, so confirm that the output format supports the intended pixel dimensions. The right match minimizes unwanted scaling and preserves image layout.
Backlight degradation and display service life
Backlight degradation is the gradual loss of light output from a display’s illumination component. Most displays retain 70-80% of their initial brightness after 30,000-50,000 hours of operation. As output declines, the same brightness setting can produce a dimmer image, affecting visibility and making older displays harder to compare with newer units.
Service life is the period a display remains suitable for its intended work. Industrial displays are typically designed for 50,000 hours or more, while consumer displays may lose 20-30% of their initial brightness over several thousand hours. These figures describe different product categories, so evaluate the display’s actual operating hours and task rather than assuming every computer screen ages alike.
Refresh rate measures how often a display updates its image, but it doesn’t indicate remaining service life. A screen can, for example, continue refreshing normally as its backlight fades. Assess visibility and brightness consistency separately: changes in image quality can matter more than whether the display still powers on.
Installation requirements cover stable placement, a suitable power connection, and a compatible video signal. For safety, follow the display’s instructions, keep ventilation openings clear, and secure the monitor so it cannot fall. HDMI and DisplayPort cables support runs of up to 10-15 meters, while LVDS cable length is usually under 1 meter. Match the cable to the computer output and display input.
Common display technologies include LCD and OLED, while evaluation standards define ways to assess particular display types. IEC 62563-1:2010 specifies evaluation methods for medical image display systems. For equipment expected to operate for 10-15 years, assess long-term display supply or compatible replacements. A planned replacement helps maintain a consistent workflow as components age.
For support planning around diagnostic display workflows, explore diagnostic display options.
Dextro Imaging Solutions: Radcom Compact
Radcom Compact from Dextro Imaging Solutions is a next step for teams assessing display equipment for diagnostic radiology workflows. It sits alongside Dextro Reading Stations and PACS Harmony, giving imaging departments options to consider across display and workflow needs.
Consider these offerings when a general-purpose screen no longer suits your image-review environment or when planning a diagnostic display setup. Compare the role each component will play in your workflow, including how monitors and PACS work together. The right configuration depends on the intended use and the equipment already in place.
Contact Dextro Imaging Solutions or visit radmadesimple.com to discuss your imaging display needs.
Plan Your Next Display Decision
Make your next display decision part of a broader workflow plan. Identify the image-review tasks your team needs to support, how displays fit into existing systems, and which compatibility requirements matter as equipment changes. This makes comparing standard display systems a practical decision about workflow needs, not just a specification checklist.
Dextro Imaging Solutions offers Radcom Compact, Dextro Reading Stations, and Jusha Diagnostic Monitors. Consider these options when planning diagnostic imaging equipment around your department’s requirements. Clarifying the intended use and current setup helps focus the discussion on relevant solutions without adding unnecessary complexity.
Take the next step by sharing your imaging display priorities with Dextro Imaging Solutions. Contact Dextro Imaging Solutions to discuss your needs and move forward with a more considered equipment plan.
Frequently Asked Questions
What Are Display Systems?
Display systems combine equipment and software to present visual information from a source. A typical setup includes a computer or imaging workstation, a graphics output, and a monitor. Standard display systems, for example, can show reports, reference images, and other workstation content. The complete system includes the parts that create, transmit, and display the output, not just the panel.
What does “standard display” mean?
“Standard display” is a descriptive term for general-purpose display equipment, rather than one universal technical specification. It can refer to screens used for everyday computing, office work, or routine image viewing. The phrase alone doesn’t define image quality or intended use. Compare the display’s role, connected equipment, and task requirements before treating two standard display systems as equivalent.
What are common types of standard display systems?
Common display technologies include LCD, OLED, plasma, and older CRT screens. They differ in how they produce images, while product categories reflect their intended use. A workplace computer may use a general-purpose monitor, whereas a radiology department may choose a diagnostic monitor for medical imaging workflows. The useful distinction is the task each system supports, not the technology label alone.
What are the common risks, limitations, and maintenance needs of display systems?
Common concerns include a display that no longer suits its task, inconsistent image presentation across workstations, and connection problems that interrupt use. Build a maintenance routine that checks image appearance, cable connections, and system compatibility after equipment changes. Keep an inventory of display models and their roles so teams can plan replacements without confusing general-purpose screens with equipment intended for diagnostic imaging.


